22. März 2024|icdc-news-de
Verlängerung der S3-OLCI Landoberflächenparameter-Datensätze
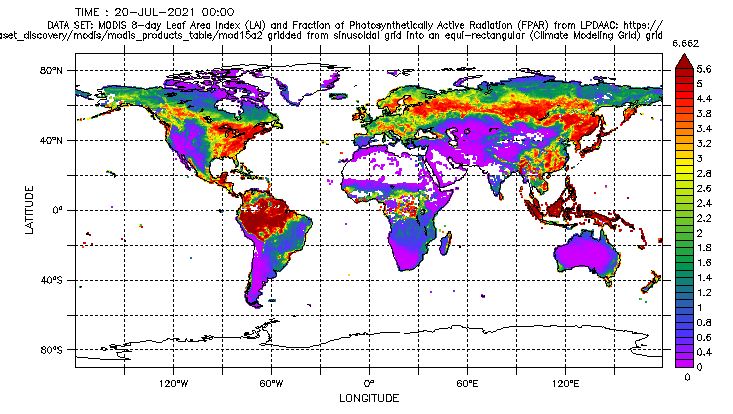
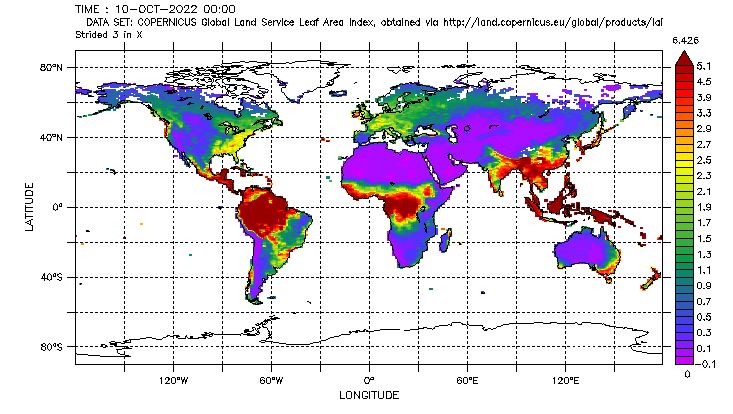
Wir haben die LAI, FAPAR und Vegetation Cover Fraction Datensätze von S3-OLCI um ein Jahr verlängert. Diese sind jetzt verfügbar auf einem globalen Gitter mit 300 m Auflösung oder mit 0,5 Grad Auflösung - für Januar 2014 bis Dezember 2023:
SPOT/PROBA-V/S3-OLCI Vegetation Cover Fraction
SPOT/PROBA-V/S3-OLCI LAI
...